Recovering Housing Market and Resilient Consumers Boost the Mass Economy in the 3rd Quarter, UMass Journal Reports
Federal fiscal policies continue to restrain growth.
October 2013
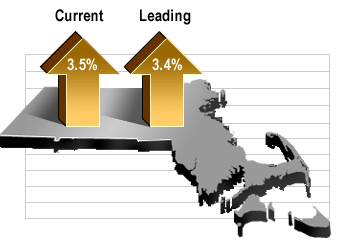 Massachusetts real gross domestic product grew at an annual rate of 3.5 percent in the third quarter of 2013 according to the latest MassBenchmarks Current Economic Index, released today by MassBenchmarks, the journal of the Massachusetts economy published by the UMass Donahue Institute in collaboration with the Federal Reserve Bank of Boston.
In contrast, U.S. real gross domestic product grew at an annual rate of 2.8 percent. In the second quarter, economic activity in Massachusetts grew at a 1.7 percent annual rate, revised up from 0.8 percent, versus a 2.5 percent pace of expansion for the U.S. In the first quarter, the Massachusetts economy expanded at a 3.4 percent annual rate as compared to 1.1 percent for the U.S. The improvement in the third quarter is due to slow, but better job growth, rising wage and salary incomes, and a higher rate of spending on items subject to sales taxes. A recovering housing market and consumer and business spending are driving economic growth, providing some relief from the considerable federal fiscal drag in the form of mandated sequestration spending cuts and higher payroll taxes than last year that continues to slow both state and national growth.
 "Our estimate of the state's economic growth in the third quarter is based on incomplete data because of a delay in the state's employment report for September until November 22, a direct result of the shutdown of the federal government last month," noted Dr. Alan Clayton-Matthews, MassBenchmarks Senior Contributing Editor and Associate Professor of Economics and Public Policy at Northeastern University, who compiles and analyzes the Current and Leading Indexes.
"Of the four Massachusetts economic indicators used to estimate state GDP growth, only September payroll employment is missing. To fill that gap, we have estimated the missing data using the U.S. employment report for September and the historical average relationship between national and Massachusetts state employment. Applying this method, we estimate that Massachusetts added a modest 1,000 jobs in September, indicating that state employment expanded at an annualized rate of growth of 0.7 percent in the third quarter. In contrast, during the second quarter, payroll employment in the Bay State declined at an 0.3 percent annualized rate," Clayton Matthews added.
Based on state withholding and sales taxes, nominal wage and salary income increased at a 2.9 percent annualized rate in the third quarter, and nominal spending on items subject to regular sales taxes and automobiles increased at a brisk 6.5 percent annualized rate. In contrast, wage and salary income in the second quarter declined by 6.9 percent, and spending increased by a more modest 2.0 percent.
The Massachusetts unemployment rate, which rose from 6.4 percent in March to 7.0 percent in June and to 7.2 percent in August, is expected to fall a notch to 7.1 percent in September.1
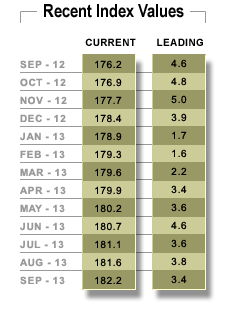
The MassBenchmarks Leading Economic Index for September was 3.4 percent, and the three-month average for July through September was 3.6 percent. The leading index is a forecast of the growth in the current index over the next six months, expressed at an annual rate.
According to the Leading Index, economic growth is estimated to continue to improve over the next six months, growing at an annualized rate of 3.4 percent from October through next March. The indicators on which the Leading Index is based, however, do not incorporate the effects of the federal government shutdown and its aftereffects (including the continuation of sequestration spending reductions), since most of the information on which the index is based was collected through September, before the shutdown began. Therefore, fourth quarter growth will likely be several tenths of a percentage point lower than the 3.4 percent projected by the Index.
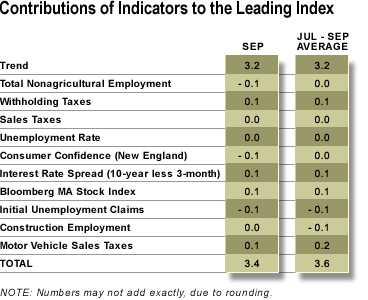 The 10 indicators that comprise the leading index usually do not all move in tandem. Typically, some may indicate an expectation of faster than average growth, while at the same time others may indicate an expectation of slower than average growth. The following table accounts for the contributions of each towards faster or slower growth than the long-term trend of 3.2 percent. The index value is their sum.
In September, four indicators contributed to a forecast of above-trend growth: withholding taxes, the interest rate spread between 10‑year and 3‑month U.S. Treasury securities, the Bloomberg stock index for Massachusetts, and motor vehicle sales taxes. Three indicators contributed to below-trend growth: total nonagricultural employment, consumer confidence, and initial unemployment claims. Three indicators contributed to average-trend growth: sales taxes, the unemployment rate, and construction employment.
In the three-month period July through September, four indicators contributed to a forecast of above-trend growth: withholding taxes, the interest rate spread between 10‑year and 3‑month U.S. Treasury securities, the Bloomberg stock index for Massachusetts, and motor vehicle sales taxes. Two indicators contributed to below-trend growth: initial unemployment claims, and construction employment. Four indicators contributed to average-trend growth: total nonagricultural employment, sales taxes, the unemployment rate, and consumer confidence.
The current and historical quarterly estimates for state domestic product growth include adjustments for changes in productivity growth. These adjustments are estimates of the quarterly deviations from trend in the growth of the ratio of output to employment and output to wage and salary income. In the third quarter, these adjustment added 0.4 percentage points from the annual rate of growth. In the second quarter, these adjustments subtracted 0.5 percentage points from the annual rate of growth. In the first quarter, these adjustments subtracted 0.2 percentage points from the annual rate of growth. For the forecast of state domestic product growth for the fourth quarter of this year and the first quarter of next year, productivity growth is assumed to return to its long-term trend.
Several recent months of the indices are revised each release. These revisions are a result of the statistical method used to create the index, as well as revisions in the underlying indicators.
--------
All of the indicators except interest rates refer to Massachusetts. The current index is composed of four indicators: nonagricultural employment, withholding taxes, sales taxes, and the unemployment rate. The leading index includes these four current indicators plus the other six (leading) indicators in the contributions table. All of the indicators are as of September, except for employment, which is through August, and interest rates and the Bloomberg stock index for Massachusetts, which are through October 30. The MassInsight Consumer Confidence Index is released every third month. Intervening months are interpolated, and changes in the Conference Board’s Consumer Confidence Index for the U.S. are used to extrapolate to the current month of the index, as needed. Series measured in dollars, i.e., withholding taxes, sales taxes, the Bloomberg stock index, and motor vehicle sales taxes, are deflated by the U.S. consumer price index for all urban consumers, excluding food and energy.
For a description of the methodology used to construct these indices, see: Alan Clayton-Matthews and James H. Stock, "An application of the Stock/Watson index methodology to the Massachusetts economy," Journal of Economic and Social Measurement, vol. 25 (1998/1999), pp. 183-233.
--------
1.) The unemployment rate used in the Current Index is taken from the Current Population Survey for Massachusetts, which was available for September. This unemployment rate differs from the official unemployment rate from the BLS, which is based on the Current Population Survey but which uses a statistical model to smooth the raw survey estimates. A simple statistical model estimates that the BLS estimate for September will be 7.1 percent.
Dr. Alan Clayton-Matthews
MassBenchmarks
Northeastern University, School of Public Policy and Urban Affairs
November 7, 2013