State economy contracted modestly in Q1 2025, UMass journal reports
Declining confidence, weaker consumer spending, and lagging job growth restrain state growth
May 2025

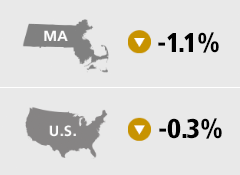
In the first quarter of 2025, Massachusetts real gross state product (GDP) decreased at an annual rate of 1.1 percent, according to MassBenchmarks, while U.S. GDP decreased at an annual rate of 0.3 percent, according to the U.S. Bureau of Economic Analysis (BEA). In the fourth quarter of 2024, Massachusetts GDP and U.S. GDP increased at annual rates of 1.9 percent and 2.4 percent respectively, according to the BEA.
Economic growth slowed in the first quarter of this year, primarily due to a surge in imports and a weakening of consumer spending. Businesses stocked up on pre-tariff goods while consumers acted with caution reflecting a fall in confidence of future conditions. Whether or not consumer spending will further weaken remains unclear. Since February, economic volatility and uncertainty has been fueled by a series of tariff announcements, threats, and postponements. This has had a demonstrable and negative impact on both state and national consumer and business confidence and helps to explain weakening consumer spending in the first three months of 2025. This volatility is roiling financial markets, which have experienced meaningful declines in the wake of a series of announcements of major changes in federal fiscal and trade policies.
Notwithstanding the apparent dampening effect of these developments on consumer spending, while these policy shocks have changed expectations, they were not in place long enough to have a substantial impact on economic activity in the first quarter. Despite all the talk of tariffs, there were only two tariff increases in the first quarter: on February 4th, 10 percent tariffs were made effective on China, and on March 12, steel and aluminum tariffs went into effect. The so-called “Liberation Day” tariffs were not announced until April 2, just as the second quarter began.
Labor markets in the first quarter were little changed from last year. Massachusetts continued to see little change in overall employment levels and trailed the nation in job growth in Q1. State payroll employment declined at a 0.1 percent annual rate in the first quarter, following growth of 0.1 percent in the fourth quarter of 2024, and a decline of 0.2 percent from the first quarter of 2024. U.S. employment, in contrast, grew at a 1.4 percent annual rate in the first quarter, following growth of 1.3 percent in the fourth quarter of last year, and 1.2 percent growth from the first quarter of 2024. Lagging job growth is the main reason Massachusetts trailed the nation in GDP growth most of last year and during the first three months of 2025.
The unemployment rate in Massachusetts in March was 4.4 percent, exceeding the 4.2 percent rate in the U.S. Given the state’s demographics, with a higher proportion of college-educated adults, the state’s unemployment rate is typically lower than the nation’s. This suggests that the labor market may be weaker in Massachusetts than nationally. However, initial unemployment claims in the state, as measured by the number of first payments, are low, and have not been rising, even though the unemployment rate in the state rose 0.6 percentage points from March of 2024.
“The rise in the unemployment rate has been accompanied by a growing labor force and working-age population — defined as persons 16 years of age or older,” noted Alan Clayton-Matthews, Senior Contributing Editor and Professor Emeritus of Economics and Public Policy at Northeastern University, who compiles and analyzes the Current and Leading Indexes for MassBenchmarks. The labor force grew 1.6 percent from the first quarter of 2024 to the first quarter of this year, while the working-age population grew 0.8 percent over the same period. “This suggests the increase in the unemployment rate was the result of an increase in labor supply, rather than a decrease in labor demand,” Clayton-Matthews added.
The broader U-6 unemployment rate, which includes part-time workers who want full-time work and persons who have looked for work in the past year but not the most recent four weeks as unemployed, was 7.9 percent in Massachusetts in March, according to MassBenchmarks, equal to that of the U.S. In December, these unemployment rates were 6.9 percent in Massachusetts and 7.5 percent in the U.S. In March of 2024, the Massachusetts and U.S. rates were 7.0 percent and 7.3 percent, respectively.
Wage and salary income in Massachusetts, based on income withholding tax revenue, rose at an annual rate of 26.8 percent in the first quarter. In the fourth quarter of last year, the BEA estimates that state wage and salary income grew at 4.7 percent annual rate. Relative to the first quarter of 2024, the tax-based estimate of wage and salary income rose 9.1 percent. These tax-based measures reflect withholding on bonuses, which tend to be received in the fourth and first quarters of the calendar year. Because the data are seasonally adjusted, the large growth in the first quarter reflects better-than-average bonuses. The S&P stock index, for example, rose about 20% during 2024. The state’s new surtax on incomes over one million dollars, in force since January 2023, also makes withholding tax revenue more volatile. Fluctuations in tax revenues from bonus income for high-income recipients are larger, and fluctuations on withholding tax revenues on high-income earners are also magnified by the surtax.
U.S. wage and salary income rose at a 4.6 percent annual rate in the first quarter according to the BEA. In the fourth quarter of last year, U.S. wage and salary income rose at a 5.1 percent rate. First quarter U.S. wage and salary income was 3.7 percent higher than in the first quarter of 2024.
Spending on items subject to the Massachusetts regular and motor vehicle sales taxes rose at a 1.3 percent annual rate in the first quarter, after falling by a 2.3 percent annual rate in the fourth quarter of last year. In the first quarter, this spending rose by 3.3 percent from the first quarter of 2024. These estimates are seasonally adjusted but are not adjusted for inflation and are concentrated in spending on taxable goods (services are essentially untaxed). Inflation for goods and especially durable goods has tended to be substantially lower than overall inflation in the last two years. For example, in the 12-month period ending in February 2025, the Personal Consumption Expenditure (PCE) price index for durable goods fell 1.6 percent. However, tariffs are expected to reverse this trend. The PCE inflation rate for durable goods in the first two months of this year has already exceeded the PCE for all expenditures.
Inflation in the Boston metropolitan area has been somewhat higher than that of the average U.S. metro area, according the BLS’s CPI-U headline measure. In the first quarter of this year, the CPI rose at a 5.0 percent annual rate in Boston versus 3.8 percent for the U.S. For the core index, which excludes food and energy, Boston’s CPI rose 5.9 percent as compared to 3.5 percent for the U.S. Relative to the first quarter of last year, the overall index was up 3.2 percent in Boston versus 2.7 percent for the U.S., while the core index was up 3.6 percent in Boston versus 3.1 percent for the U.S.
The leading index is projecting that the rate of growth in Massachusetts GDP will continue to be slow, at an annual rate of 0.7 percent in the second quarter and 1.2 percent in the third quarter. The average growth projections for U.S. GDP from the Wall Street Journal survey of economists in early April is projecting annual rates of 0.8 percent for the second quarter and 0.6 percent for the third quarter.
These projections are tentative and could change abruptly depending on the course of U.S. tariff policy. The real effects of increased tariffs on economic growth — as opposed to the effects on expectations or financial markets, will develop with a lag and so impacts on employment and output are likely to be revealed later this year, perhaps by the fourth quarter.