Massachusetts Population Estimates Program
Table 1. Annual and Cumulative Estimates of Resident Population Change for the United States, Regions, and Northeast States and Rankings: July 1, 2016 to July 1, 2017 and April 1, 2010 to July 1, 2017
Table description.
| Geographic Area | Population | Population Estimate (as of July 1) |
Population Ranking | Annual Change July 1, 2016 to July 1, 2017 |
Cumulative Change 2010-2017 |
|||||||||
|---|---|---|---|---|---|---|---|---|---|---|---|---|---|---|
| April 1, 2010 Base |
2016 | 2017 | April 1, 2010 Base |
July 1, 2017 | Change 2016 to 2017 |
Percent Change 2016 to 2017 |
Rank Change 2016-2017 |
Cumulative Change 2010-2017 |
Percent Change 2010-2017 |
Rank Change 2010-2017 |
||||
| Number | Percent | Number | Percent | |||||||||||
| United States | 308,758,105 | 323,405,935 | 325,719,178 | (X) | (X) | 2,313,243 | 0.7% | (X) | (X) | 16,961,073 | 5.5 | (X) | (X) | |
| Northeast | 55,318,350 | 56,359,360 | 56,470,581 | 4 | 4 | 111,221 | 0.2% | 4 | 4 | 1,152,231 | 2.1 | 4 | 3 | |
| Midwest | 66,929,794 | 67,978,168 | 68,179,351 | 3 | 3 | 201,183 | 0.3% | 3 | 3 | 1,249,557 | 1.9 | 3 | 4 | |
| South | 114,563,024 | 122,423,457 | 123,658,624 | 1 | 1 | 1,235,167 | 1.0% | 1 | 1 | 9,095,600 | 7.9 | 1 | 1 | |
| West | 71,946,937 | 76,644,950 | 77,410,622 | 2 | 2 | 765,672 | 1.0% | 2 | 2 | 5,463,685 | 7.6 | 2 | 2 | |
| Connecticut | 3,574,114 | 3,587,685 | 3,588,184 | 29 | 29 | 499 | 0.0% | 42 | 43 | 14,070 | 0.4 | 46 | 48 | |
| Maine | 1,328,362 | 1,330,232 | 1,335,907 | 41 | 42 | 5,675 | 0.4% | 38 | 28 | 7,545 | 0.6 | 47 | 46 | |
| Massachusetts | 6,547,808 | 6,823,721 | 6,859,819 | 14 | 15 | 36,098 | 0.5% | 17 | 24 | 312,011 | 4.8 | 14 | 26 | |
| New Hampshire | 1,316,460 | 1,335,015 | 1,342,795 | 42 | 41 | 7,780 | 0.6% | 37 | 22 | 26,335 | 2.0 | 43 | 38 | |
| New Jersey | 8,791,953 | 8,978,416 | 9,005,644 | 11 | 11 | 27,228 | 0.3% | 22 | 33 | 213,691 | 2.4 | 19 | 35 | |
| New York | 19,378,110 | 19,836,286 | 19,849,399 | 3 | 4 | 13,113 | 0.1% | 30 | 41 | 471,289 | 2.4 | 9 | 34 | |
| Pennsylvania | 12,702,857 | 12,787,085 | 12,805,537 | 6 | 5 | 18,452 | 0.1% | 25 | 39 | 102,680 | 0.8 | 28 | 43 | |
| Rhode Island | 1,052,945 | 1,057,566 | 1,059,639 | 43 | 43 | 2,073 | 0.2% | 41 | 37 | 6,694 | 0.6 | 48 | 45 | |
| Vermont | 625,741 | 623,354 | 623,657 | 49 | 50 | 303 | 0.0% | 43 | 42 | -2,084 | -0.3 | 49 | 50 | |
UMass Donahue Institute. Source data: Annual Estimates of the Resident Population for the United States, Regions, States, and Puerto Rico: April 1, 2010 to July 1, 2017 (NST-EST2017-01) and NST-EST2017-03. U.S. Census Bureau, Population Division. December 2017.
Figure 1. Annual Percent Change in Population 2010-2017 for the United States, Regions, and Massachusetts
Figure description.
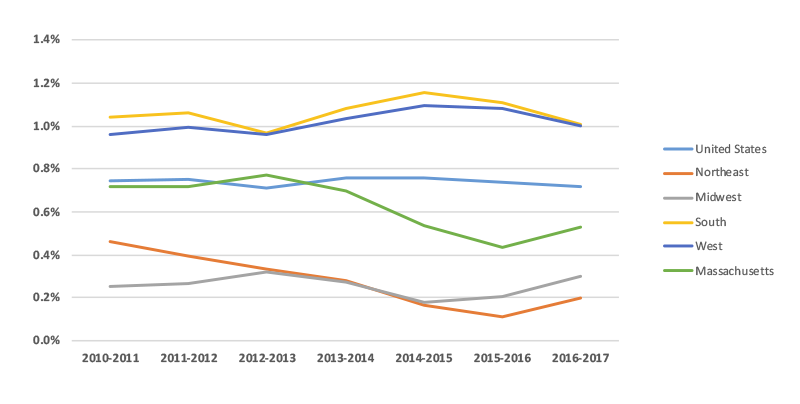
Citation: UMass Donahue Institute. Source data: NST-EST2017-01. U.S. Census Bureau, Population Division. December 20, 2017.
Map 1. Estimated Cumulative Change in Population by U.S. State, Census 2010 to July 1, 2017
Figure description.
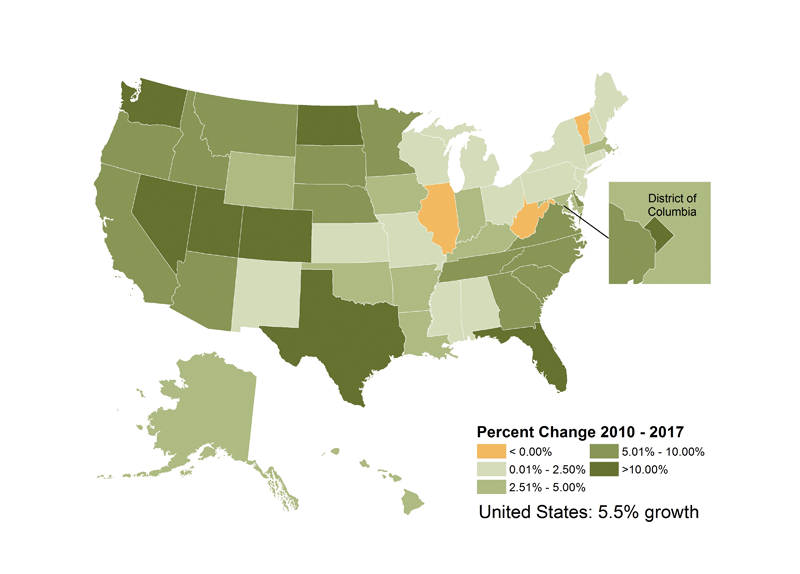
Source: UMass Donahue Institute. Cumulative Estimates of the Resident Population Change for the United States, Regions, States, and Puerto Rico: April 1, 2010 to July 1, 2017. U.S. Census Bureau, Population Division. Release Date: December 20, 2017.
Map 2. Estimated Percent Change in Population by U.S. State, July 1, 2016 to July 1, 2017
Figure description.
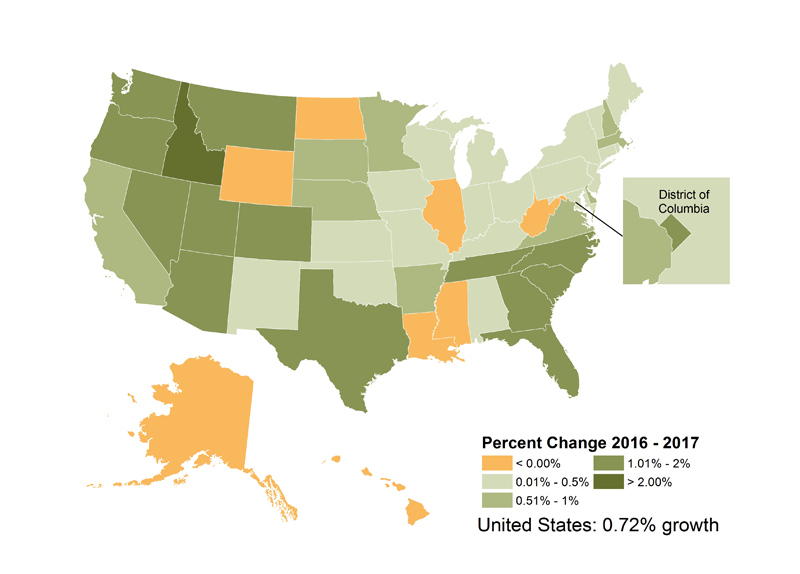
Source: UMass Donahue Institute Annual Estimates of the Resident Population Change for the United States, Regions, States, and Puerto Rico: April 1, 2010 to July 1, 2017 U.S. Census Bureau, Population Division. Release Date: December 20, 2017
Figure 2: Massachusetts Annual % Growth Over Previous Year 2001-2017
Figure description.
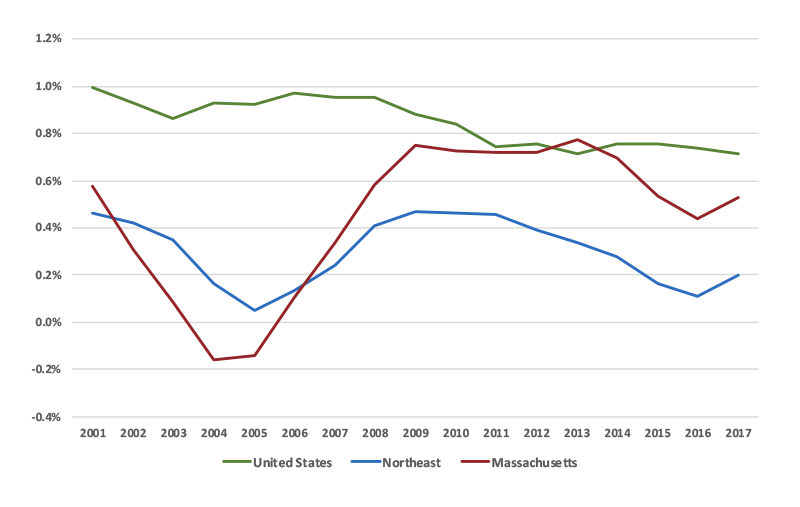
UMass Donahue Institute. Source Data: Intercensal Estimates of the Resident Population for the United States, Regions, States, and Puerto Rico: April 1, 2000 to July 1, 2010 (ST-EST00INT-01). Release Date: September 2011 and Annual Estimates of the Population for the United States, Regions, States, and Puerto Rico: April 1, 2010 to July 1, 2017 (NST-EST2017-01) Release Date: December 2017. U.S. Census Bureau, Population Division.
Figure 3: Massachusetts Estimated Components of Change, 2017
Figure description.
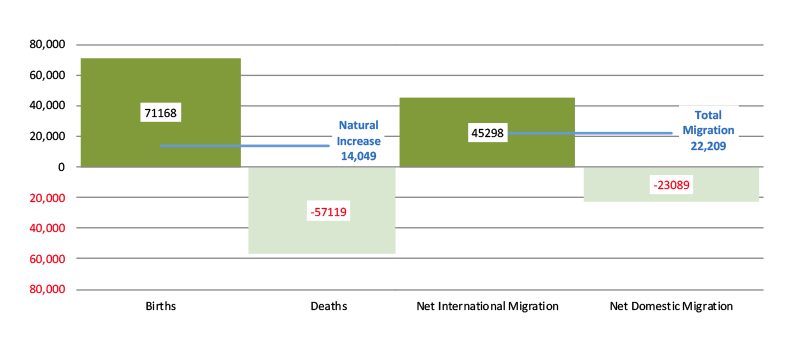
Source: UMass Donahue Institute. NST-EST2017-ALLDATA. U.S. Census Bureau, Population Division. December 2017.
Figure 4: Massachusetts Estimated Components of Change 2000-2017
Figure description.
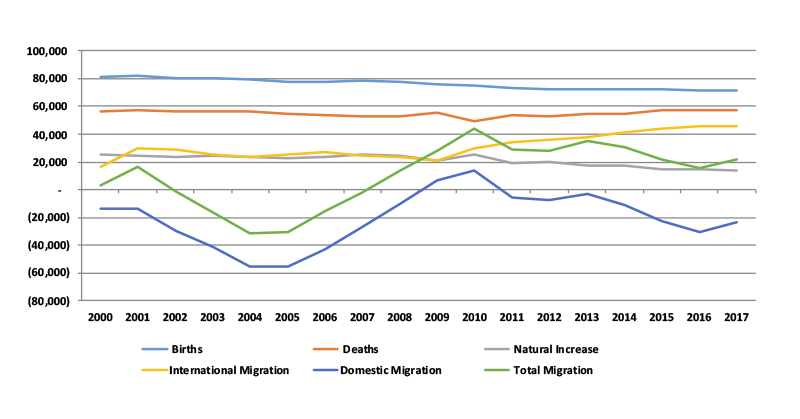
Source: UMass Donahue Institute. ST-2000-7; CO-EST2010-ALLDATA and NST-EST2017-ALLDATA. U.S. Census Bureau, Population Division.
Table 2. Estimated Components of Resident Population Change for the United States, Regions, and Northeast States July 1, 2016 to July 1, 2017
Table description.
| Geographic Area | Vital Events | Net Migration | ||||
|---|---|---|---|---|---|---|
| Births | Deaths | Natural Increase | International | Domestic | Total | |
| United States | 3,946,000 | 2,744,040 | 1,201,960 | 1,111,283 | (X) | 1,111,283 |
| Northeast | 621,245 | 493,164 | 128,081 | 297,343 | (313,643) | (16,300) |
| Midwest | 822,534 | 607,187 | 215,347 | 143,872 | (156,897) | (13,025) |
| South | 1,538,511 | 1,080,064 | 458,447 | 418,768 | 356,884 | 775,652 |
| West | 963,710 | 563,625 | 400,085 | 251,300 | 113,656 | 364,956 |
| Connecticut | 35,183 | 30,245 | 4,938 | 17,758 | (22,270) | (4,512) |
| Maine | 12,504 | 13,739 | (1,235) | 1,578 | 5,376 | 6,954 |
| Massachusetts | 71,168 | 57,119 | 14,049 | 45,298 | (23,089) | 22,209 |
| New Hampshire | 12,459 | 11,559 | 900 | 2,236 | 4,687 | 6,923 |
| New Jersey | 101,625 | 74,111 | 27,514 | 56,942 | (57,274) | (332) |
| New York | 232,766 | 159,676 | 73,090 | 130,411 | (190,508) | (60,097) |
| Pennsylvania | 138,818 | 131,458 | 7,360 | 37,389 | (25,793) | 11,596 |
| Rhode Island | 10,915 | 9,760 | 1,155 | 4,798 | (3,854) | 944 |
| Vermont | 5,807 | 5,497 | 310 | 933 | (918) | 15 |
UMass Donahue Institute. Source: U.S. Census Bureau Population Division. Estimates of the Components of Resident Population Change for the United States, Regions, States, and Puerto Rico: July 1, 2016 to July 1, 2017. (NST-EST2017-05) Release date: December 20, 2017.